PS. We’ve also published a guide on the top sales metrics and benchmarks to measure against your sales outreach efforts. Feel free to check it out any time.
Disclosure: All graphics below were taken from a past project.
Top Digital Marketing Metrics And KPIs
Website Metrics
1. Total New Website Users
Definition: The number of first-time visitors to your website within a specific timeframe.
Importance: Indicates the growth and reach of your website. Tracking this metric helps you understand how effective your marketing efforts are in attracting new audiences. It’s a good starting point for deeper analysis.
Benchmarks: Varies greatly by industry and marketing efforts, but a steady month-over-month growth is desirable.
Quick Tip: Boost your website traffic by diversifying content with videos, infographics, and podcasts, etc.

2. Bounce Rate
Definition: The percentage of visitors who leave your site after viewing only one page.
Importance: A high bounce rate usually means that your site’s landing pages are not relevant or engaging enough for your audience. Lowering the bounce rate is crucial for improving user engagement and retention. This metric can also indicate the quality of your website traffic and the initial user engagement.
Benchmarks: Generally, 26% to 40% is excellent and 41% to 55% is average; above 55% is considered high for B2B sites.
Quick Tip: Make sure the content on your landing pages directly address the needs and questions of your audience.

3. Conversion Rate
Definition: The percentage of visitors who take a desired action on your site, such as making a purchase or signing up for a newsletter.
Importance: Measures how effective your site is in encouraging visitors to take specific actions.
Benchmarks: The average landing page conversion rate for B2B is around 2.23%, but top-performing companies can achieve rates above 5%.
Quick Tip: Optimize your call-to-actions. Test different placements, colors, and messaging to find what resonates best with your audience.
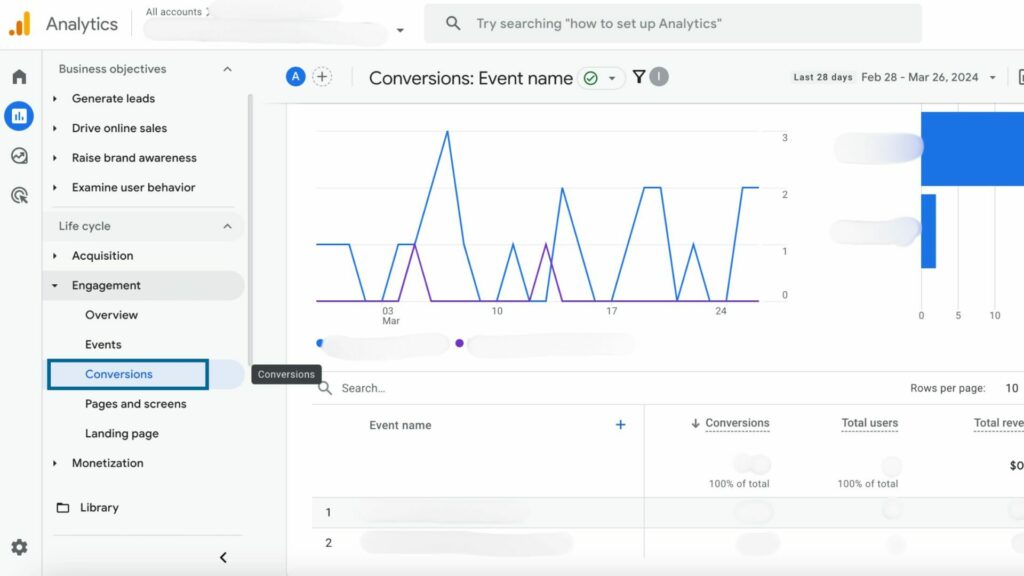
4. Average Session Duration
Definition: The average amount of time that visitors spend on your site during a session.
Importance: Longer session durations generally indicate higher engagement and interest in your content.
Benchmarks: Typically, 2-3 minutes is considered a good average, but this can vary by industry and content type.
Quick Tip: Use internal linking to encourage visitors to explore more pages on your site.

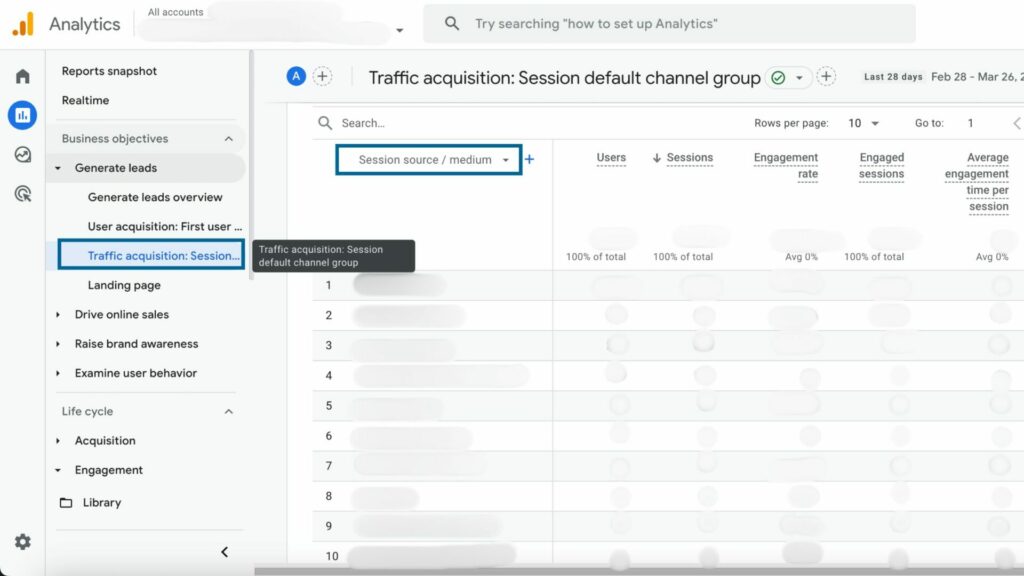
5. Traffic Acquisition Source/Medium
Definition: This metric tells you where your website traffic comes from, such as organic search, social media, or direct visits.
Importance: Knowing where your website users are coming from can help you understand what works best for your audience. It provides context to the new website users metric.
Benchmarks: Organic search and LinkedIn can generally drive a significant portion of traffic for most B2B websites.
Quick Tip: Analyze which sources are currently performing best and allocate more resources to them. For example, if LinkedIn is your top source, consider boosting your activity on the platform by posting more often and engaging with industry groups.
6. PageSpeed Insights (Mobile/Desktop)
Definition: Measures how quickly your site’s content loads for users on mobile devices and desktop.
Importance: Critical for user experience, especially since faster-loading pages are more likely to retain visitors. Page speed is also a ranking factor for SEO… meaning the faster your site, the more people will find you.
Benchmarks: A score of 90 or above is considered good, 50 to 90 needs improvement, and below 50 is poor.
Quick Tip: One easy way to improve your score is by optimizing images and videos on your website. This will ensure they’re not unnecessarily large.

Get your report here: pagespeed.web.dev/
LinkedIn Metrics
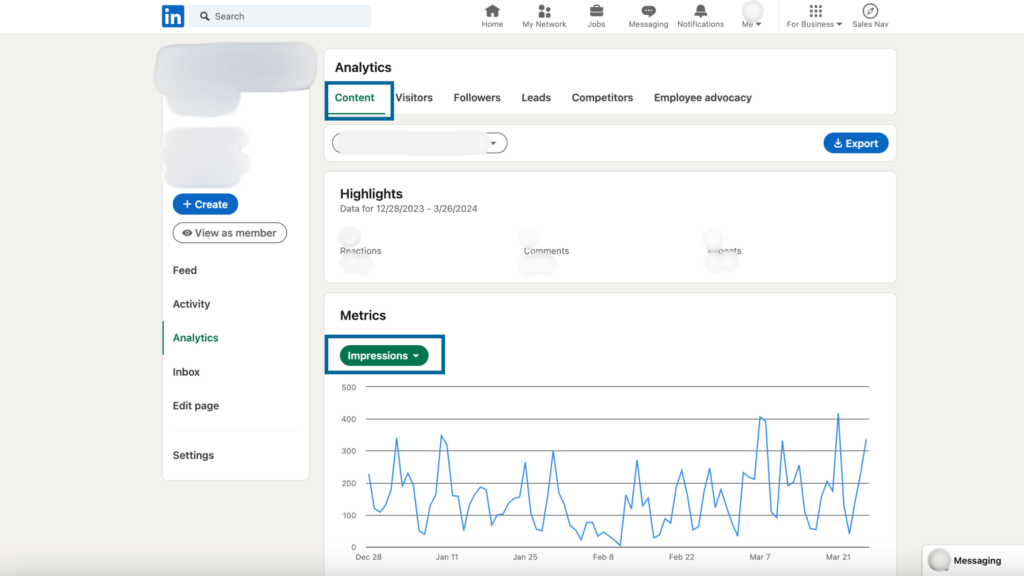
1. Impressions (Post Reach)
Definition: The number of times your posts are displayed to LinkedIn users.
Importance: Indicates the visibility and potential impact of your content on the platform.
Benchmarks: Higher numbers indicate greater visibility. Consistent growth month-over-month in followers and a steady increase in impressions per post is desirable.
Quick Tip: A/B test different types of content on your company’s page to see what resonates the most with your followers.
2. New Followers
Definition: The number of LinkedIn users who start following your company page within a certain period of time.
Importance: Indicates your brand’s growing influence and reach on the platform.
Benchmarks: Depends on the company size and industry, but look for steady growth aligned with content and engagement strategies.
Quick Tip: Share high-quality content that provides value to your audience, such as industry insights, success stories, and how-to guides.

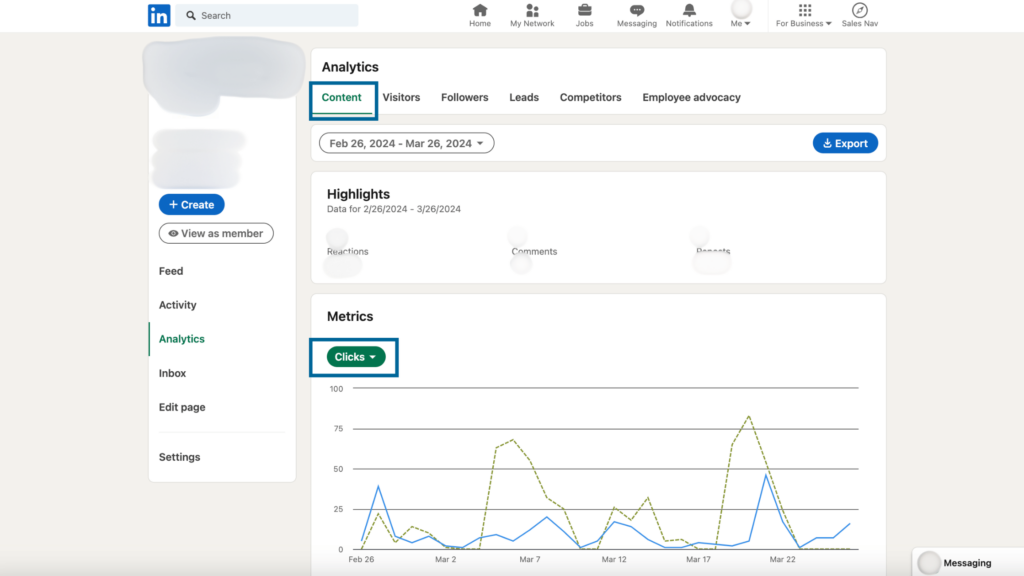
3. Number of Clicks
Definition: The total count of clicks on content, company name, or logo within a post.
Importance: Measures direct interaction with your LinkedIn content, tracking how many people are interested enough to click on your posts.
Benchmarks: This can vary widely depending on the content type and your audience’s engagement level. Consistent growth or high numbers based on impressions suggests you’re posting effective content.
Quick Tip: Make sure you are using one clear call to action (CTA) on each post. Your CTA should lead users to click for more information, visit your website, or take another desired action.
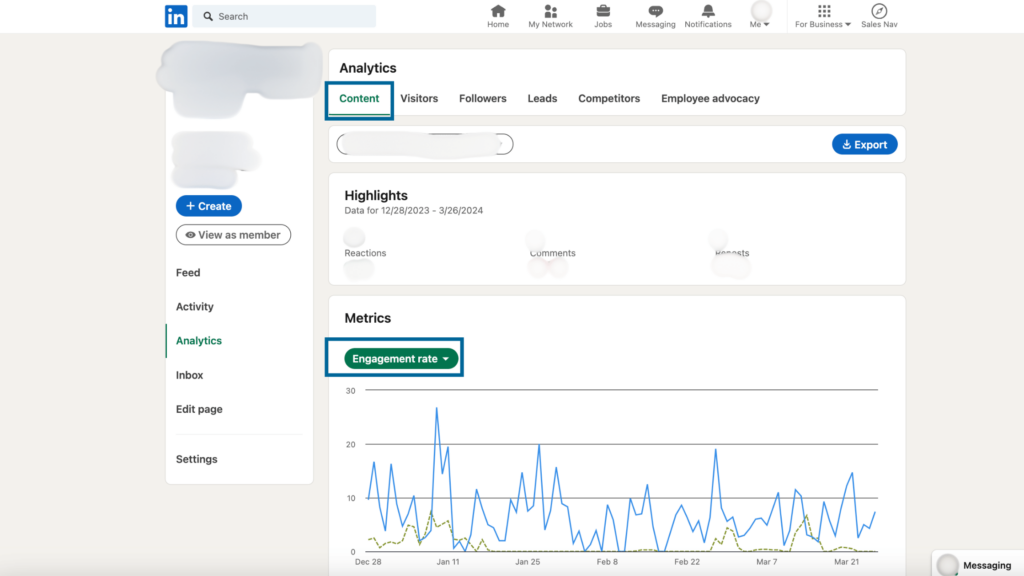
4. Engagement Rate
Definition: The total engagement (clicks, likes, comments, shares) divided by the total number of impressions, often expressed as a percentage. It’s one of the most important KPIs in digital marketing.
Importance: Gives you a comprehensive view of how your audience is interacting with your content, reflecting the quality and relevance of your posts.
Benchmarks: An engagement rate around 0.54% is average for B2B on LinkedIn. Higher rates indicate more engaging content.
Quick Tip: Create content that sparks conversation and encourages interaction, such as asking questions, sharing thought-provoking insights, or creating polls.
SEO Metrics
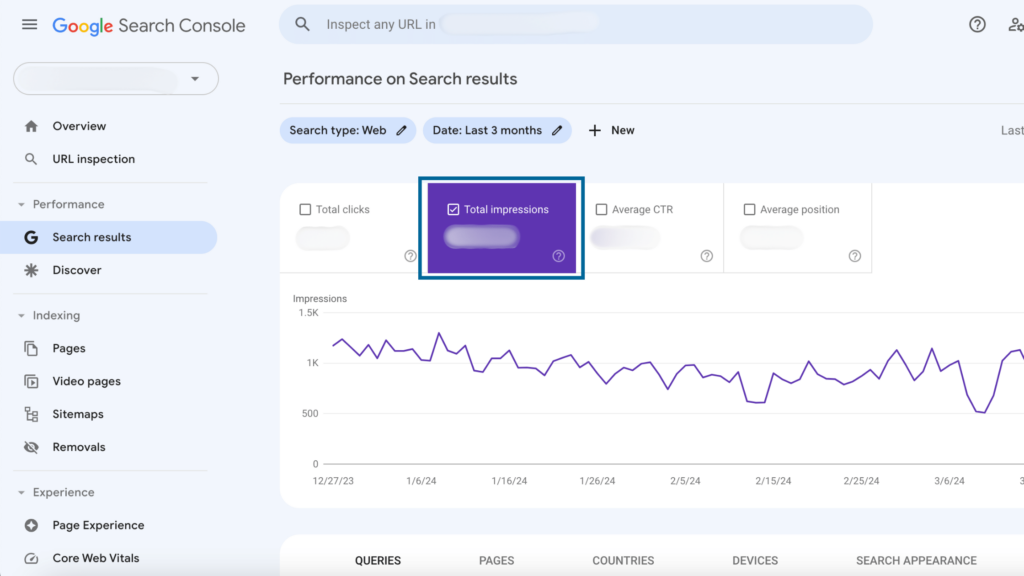
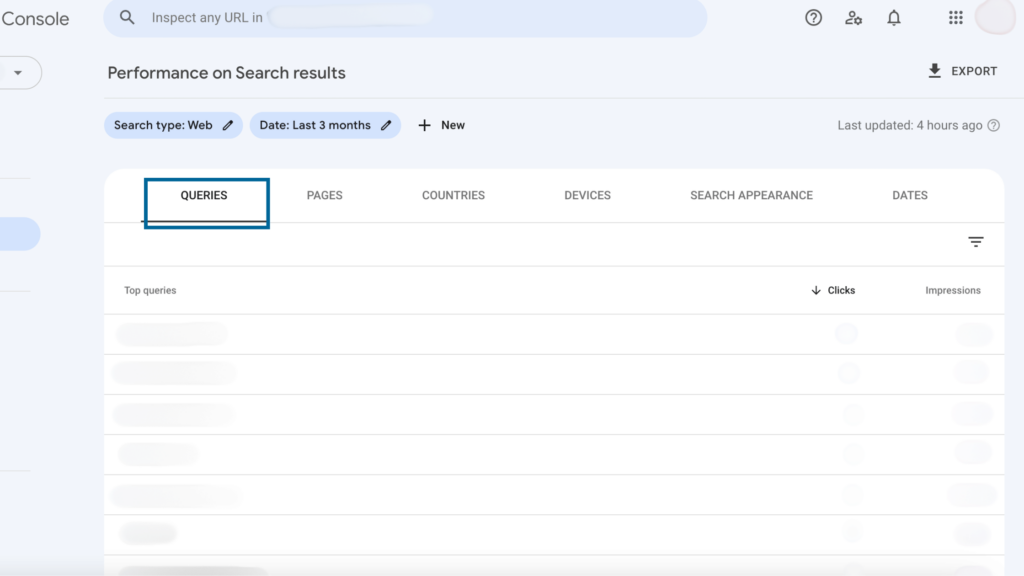
1. Google Organic Total Impressions
Definition: The total number of times a user sees a link to your site in Google search results.
Importance: High impressions can indicate strong SEO and website visibility, but always compare it to the amount of organic clicks.
Benchmarks: Varies by keyword and industry. The focus should be on the growth trend rather than specific numbers.
Quick Tip: Regularly update your site with relevant, original content that addresses the needs of your target audience.
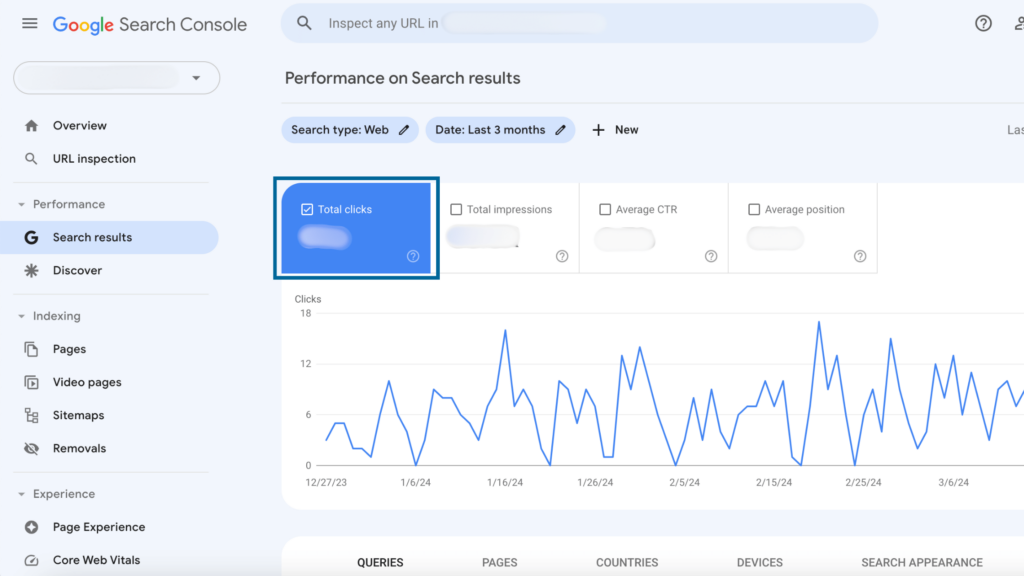
2. Google Organic Total Clicks
Definition: The total number of times users click on your site from Google search results.
Importance: Indicates the effectiveness of your SEO in driving traffic to your website.
Benchmarks: Again, varies widely by industry and keyword competition, but an increasing trend is positive.
Quick Tip: Make sure your website’s meta titles and descriptions are clear, enticing, and relevant to the search queries you want to rank for.
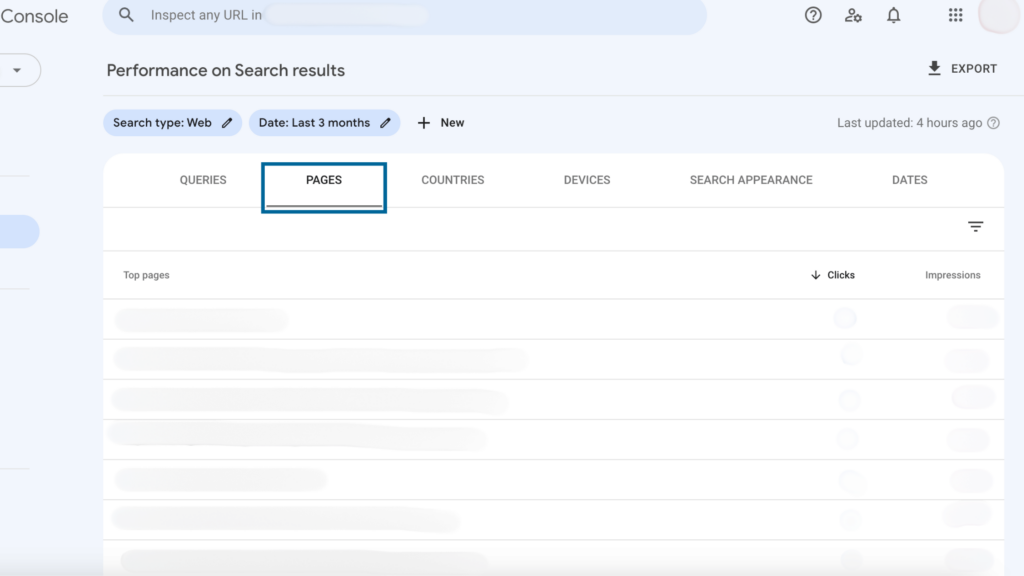
3. Top Pages
Definition: This metric identifies which pages on your website are getting the most traffic from organic search results.
Importance: It can help you analyze what content performs best and why, allowing you to replicate this success across other areas of your site. It’s crucial for content strategy and SEO optimization.
Benchmarks: There’s no specific benchmark for top pages. However, pages that significantly outperform others in terms of traffic can serve as a model for future content development and SEO strategy.
Quick Tip: Create more content on topics related to your top pages. This can attract more organic traffic.
4. Keyword Rankings
Definition: The position of your website’s pages in search engine results pages (SERPs) for specific keywords.
Importance: High rankings can lead to increased visibility and traffic. Tracking keyword rankings helps you understand the effectiveness of your SEO strategies and identify areas for improvement.
Benchmarks: Being on the first page of Google’s search results is highly beneficial, as the first page accounts for over 90% of all search traffic. The top 10 positions get the majority of clicks.
Quick Tip: Use keyword research tools to identify both high-volume and niche keywords relevant to your content.
Pay Per Click (PPC) Metrics
1. Clicks and Impressions
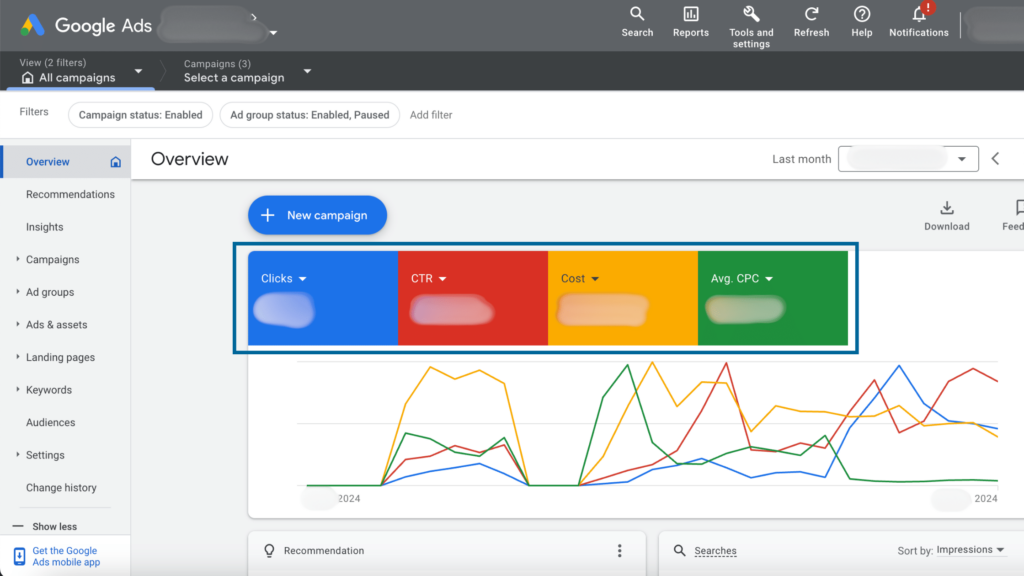
Definition: Clicks measure how many times ads were clicked, while impressions measure how many times ads were viewed.
Importance: These are core metrics that help you assess the reach and engagement of your paid campaigns. More clicks can indicate higher interest and relevance.
Benchmarks: Varies by industry, with average click-through rates (CTR) ranging from 0.35% for display ads to 1.91% for search ads. The average CTR for B2B in Google Ads is around 2.41% for search campaigns.
Quick Tip: Adjust your bids for high-performing keywords or times of the day to maximize visibility and clicks within your budget.
2. CTR (Click-Through Rate)
Definition: The number of clicks an ad gets, divided by the number of times the ad is shown (impressions), expressed as a percentage.
Importance: CTR is a key indicator of the quality of your ad creative, targeting, and relevance. A high CTR means that a higher percentage of people who see the ad find it relevant and click on it.
Benchmarks: The average CTR for paid ads varies by industry, but a general benchmark is around 2%. For Google Ads across all industries, the average is about 1.91% on the search network.
Quick Tip: A/B test different headlines, descriptions, and display paths to find the combination that gives you the highest CTR.
3. Cost
Definition: The total expense of your paid media campaign over a specific time period.
Importance: Tracking total cost is essential for budget management and calculating ROI. It helps you understand how much you are spending to achieve your ad goals.
Benchmarks: Costs can vary widely depending on the industry, target keywords, and competition. It’s more about ensuring the cost aligns with budget expectations and campaign ROI than comparing to a specific benchmark.
Quick Tip: Review and refine your targeted keywords. Pause or adjust bids on underperforming keywords to reduce ad spending.
4. Average CPC (Cost Per Click)
Definition: The average cost of a single click on your ads.
Importance: CPC helps you understand the cost-effectiveness of your paid campaigns. It’s also important for budgeting and bid management, especially if you’re working with a tight budget.
Benchmarks: Average CPC varies greatly by industry and the competitiveness of keywords. CPC can be higher in the B2B sector due to more specific targeting and competition. Average CPC can range from $2 to $5, but this can vary widely.
Quick Tip: Maintain a high quality score by optimizing your ad relevance, landing page experience, and expected CTR.
5. Optimization Score
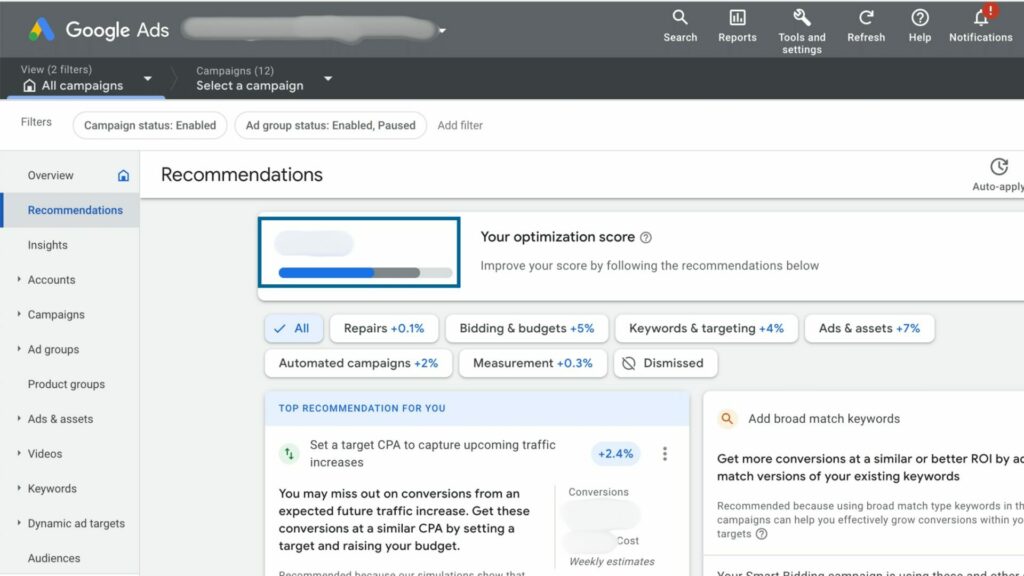
Definition: A score within Google Ads that estimates how well your campaigns are set to perform, ranging from 0% to 100%.
Importance: Helps you identify potential improvements in your campaigns. High scores indicate that a campaign is well-optimized, whereas lower scores suggest areas that could be adjusted for better performance.
Benchmarks: While 100% is the goal, striving for above 80% is a good target for B2B campaigns.
Quick Tip: Go over the recommendations provided by Google Ads and implement the ones that align with your campaign goals.
6. Number of Leads
Definition: The amount of potential clients that express interest in your products or services through your campaigns.
Importance: Leads are a direct indicator of campaign effectiveness in generating interest and potential sales. This metric is crucial for evaluating the ROI of paid media efforts.
Benchmarks: Ideal lead numbers vary based on industry, campaign scale, and budget. Success is often measured not just by the quantity of leads but also by the quality and conversion rate of those leads.
Quick Tip: Use lead magnets like free ebooks, webinars, or trial offers that require users to submit their contact information.
Email Marketing Metrics
1. Open Rate
Definition: The percentage of email recipients who open your emails.
Importance: Indicates how well your email subject lines and email copy resonate with your audience.
Benchmarks: The average open rate for B2B email marketing is around 15-22%. For some sectors, like nonprofit or education, the average can be higher.
Quick Tip: A/B test different subject lines to see which ones work best with your email recipients.
2. Click Rate
Definition: The percentage of email recipients who clicked on one or more links within an email.
Importance: Gives you insight into how engaging your email content is and whether it encourages readers to take action.
Benchmarks: The average click rate across industries is about 2.5%. Higher rates mean highly engaging content and effective calls-to-action.
Quick Tip: Make sure your emails have one clear, actionable call-to-action (CTA) that stands out.

3. Conversion Rate
Definition: The percentage of email recipients who clicked on a link within an email and completed a desired action (making a purchase, filling out a form, etc).
Importance: Helps you determine the effectiveness of email marketing in driving business goals.
Benchmarks: An average conversion rate from email marketing is around 1%, but a 2% conversion rate from click to lead is a solid benchmark for B2B.
Quick Tip: Make the journey from email to conversion as smooth as possible. Be direct and clear in communicating your value prop and what the next step is.
4. Bounce Rate
Definition: The percentage of your sent emails that could not be delivered to the recipient’s inbox.
Importance: High bounce rates typically mean you’re having problems with your email list’s health or delivery issues. It also provides insight into the quality of your email list.
Benchmarks: A healthy email campaign should aim for a bounce rate lower than 2%. Rates above this may indicate issues with list quality or outdated contact information.
Quick Tip: Use a double opt-in process for new subscribers to ensure that you’re collecting valid email addresses and that recipients are genuinely interested in your content.
Driving Revenue Growth Through Strategic Marketing
We’ve successfully grown businesses like Velostics by creating customized inbound marketing plans for them. Our strategies, especially with Google and LinkedIn Ads, have boosted their total revenue by 29%. Check out their success story to see how we did it.
Spread the word and share with your network!


